ODDOSCOPE ORIGINAL / STORY / 3 MIN
When a Number Needs a Neighbor
An impressive increase becomes a different story when the total walks into the room.
From The Internet & Your Brain
The poster is technically correct
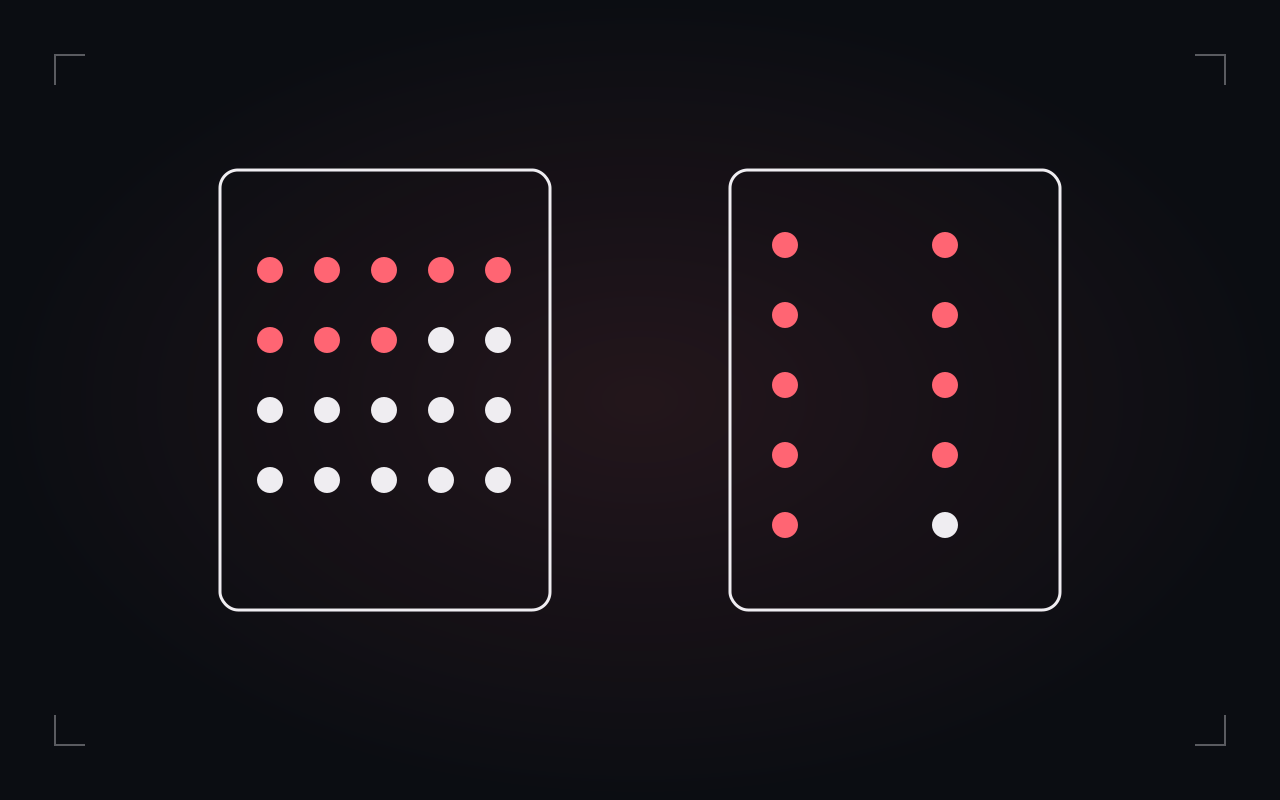
Our fictional café has a new poster: “Twice as many happy customers!” On Monday, two people left a happy note. On Tuesday, four did. Four is twice two. The café's imaginary marketing department is delighted and has already ordered a larger marker. Now meet the number's missing neighbor. Ten people visited on Monday; forty visited on Tuesday. The happy-note share was two out of ten, or 20%, followed by four out of forty, or 10%. The count rose while the share fell. These invented numbers describe the same little event in two different ways.
Choose the question before the calculation
If you want to know how many happy notes the café received, the counts answer your question. If you want the share of visitors who left one, you need the totals. If you want to know whether the coffee improved, neither calculation is enough. A missing note might mean an unhappy customer, a busy customer or a customer who never saw the note box. Dividing by a total does not magically produce the right measure. It produces a particular measure. We should be able to say what its numerator and denominator represent, over which period, and why that comparison helps with our actual question.
A second number can still hide a third question
Suppose a neighboring fictional café reports 45 happy responses from 50 survey participants. That is 90%. Very neat. But imagine it invited only loyalty-card holders while the first café asked everyone buying a drink that morning. We have now calculated the answers accurately and compared different groups. Survey researchers distinguish how people were recruited, rather than judging a sample by its size alone. Pew Research Center's methods explanation discusses the difference between probability-based recruitment and opt-in samples. Our café is not an actual survey study; it is a small way to notice why the route into a dataset matters.
Give the claim some company
Try this with another invented claim: an app says complaints fell from 12 to 6 while orders fell from 120 to 30. The complaint count halved. The complaint share went from 10% to 20%. Which statement belongs in a report about customer experience? A useful report would show both and explain what counts as a complaint. Before sharing a dramatic comparison, ask for the starting value, the total, the time window and the collection method. Sometimes that makes a claim less dramatic. Sometimes it makes it more concerning. Either way, the number has become easier to interpret. The Missing Denominator lets you follow the café's paperwork and decide which conclusion the evidence can actually support.
Sources & editorial notes
- Seeing Theory, Brown University: Basic Probability (archived)
- Pew Research Center: What are nonprobability surveys?
Rights: Original Oddoscope text and code-authored SVG illustration. External references are linked for attribution, not reproduced or licensed by the presence of a link.