FREE EDITION / Story / 5 MIN
A Small Chance in a Large Room
A fictional invitation filter catches most wanted messages. That does not tell you what an alert means. Start with the whole room.
By the Oddoscope editorial desk. Times include reflection and are estimates.
The exciting alert
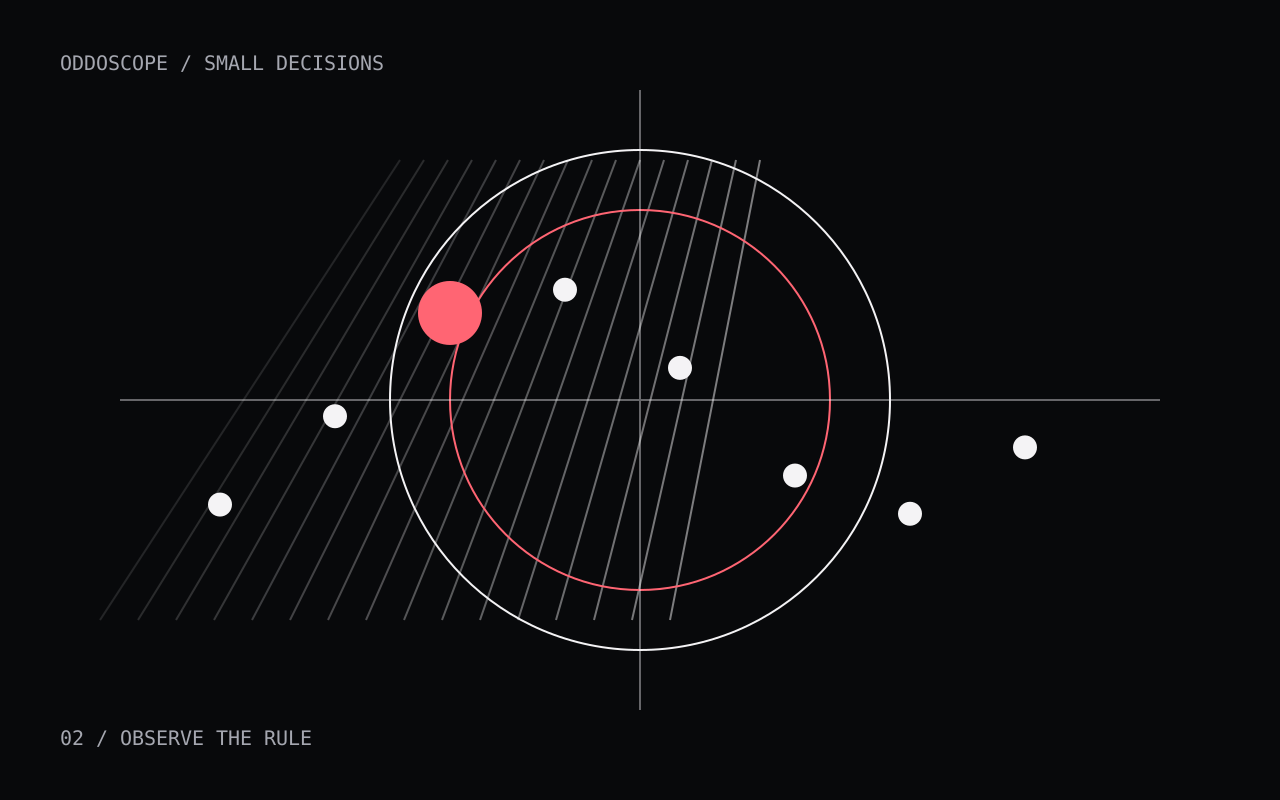
Imagine a fictional invitation filter for a community workshop. Out of 1,000 messages, exactly ten contain a genuine invitation that the organizer wants to see. The filter flags nine of those ten. It also flags 99 of the other 990 messages. A banner says the filter catches nine out of ten wanted invitations. That statement is correct in our invented room. It does not mean that nine out of ten flagged messages are genuine invitations. There are 108 flags: nine wanted messages and 99 other messages. Only nine of those 108 flags correspond to what the organizer wants. The important mistake would be replacing the group we actually asked about with the group in the banner. We asked about flags. The banner talked about wanted invitations. Those denominators are different.
Build the room before the percentage
Use two piles of cards. Put ten cards in a small pile marked wanted and 990 in another pile marked other. Move nine cards from the first pile and 99 from the second into an alerts tray. Looking at the tray makes the denominator hard to forget. Its contents came from both piles, even though one pile was much less likely to produce an alert on any individual card. Conditional probability formalizes a question with a specified condition. OpenStax gives the multiplication rule connecting joint and conditional probabilities. Our example uses exact fictional counts to make the conditioning group visible. It is not an estimate of any real spam filter, medical test or safety system. Do not reuse the made-up rates to make a real decision about someone’s health or security.
Change one assumption
Now keep the same invented flagging proportions but imagine a room with 100 wanted invitations and 900 other messages. The filter flags 90 wanted messages and 90 other messages. Half of the 180 flags are now wanted. The filter’s two stated conditional rates did not change. The room changed, and therefore the mix in the tray changed. This is why a percentage needs a population and a direction. A product page can supply a technically accurate percentage while leaving out the group that matters to your question. Before you share an impressive figure, translate it into counts for a stated population. If the necessary rate is missing, leave the answer unknown rather than quietly inventing a plausible number.
A question you can carry
Ask: out of all the things that triggered this signal, how many are the thing I care about? Then ask what information would let you count that group. Sometimes the answer is available in a confusion matrix or a clearly defined evaluation set. Sometimes it is not. The honest conclusion can be that the headline alone cannot answer your question. In the rest of this route, the same discipline applies to queues and cooperation. A completed-job count needs the unfinished jobs beside it. A high personal score needs the other participant’s score beside it. Name the denominator, keep the comparison visible, and resist turning one successful number into a complete description of the system. That is the practical habit, even when the arithmetic is simple.
Sources and editorial notes
OpenStax — Introductory Statistics 2e, 3.3 — Authored open textbook: conditional probability and the multiplication rule. The fictional counts below are arithmetic examples, not measured rates.
Original Oddoscope writing and artwork. All scenarios and numbers are fictional teaching examples; sources are credited, not reproduced.